Sprawlball NFL
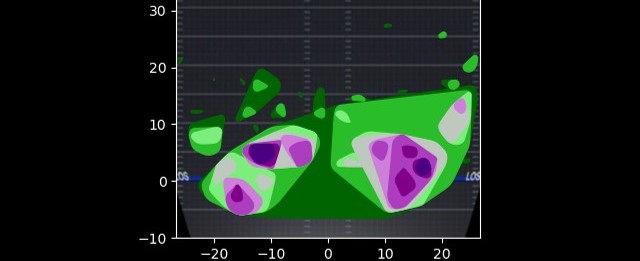
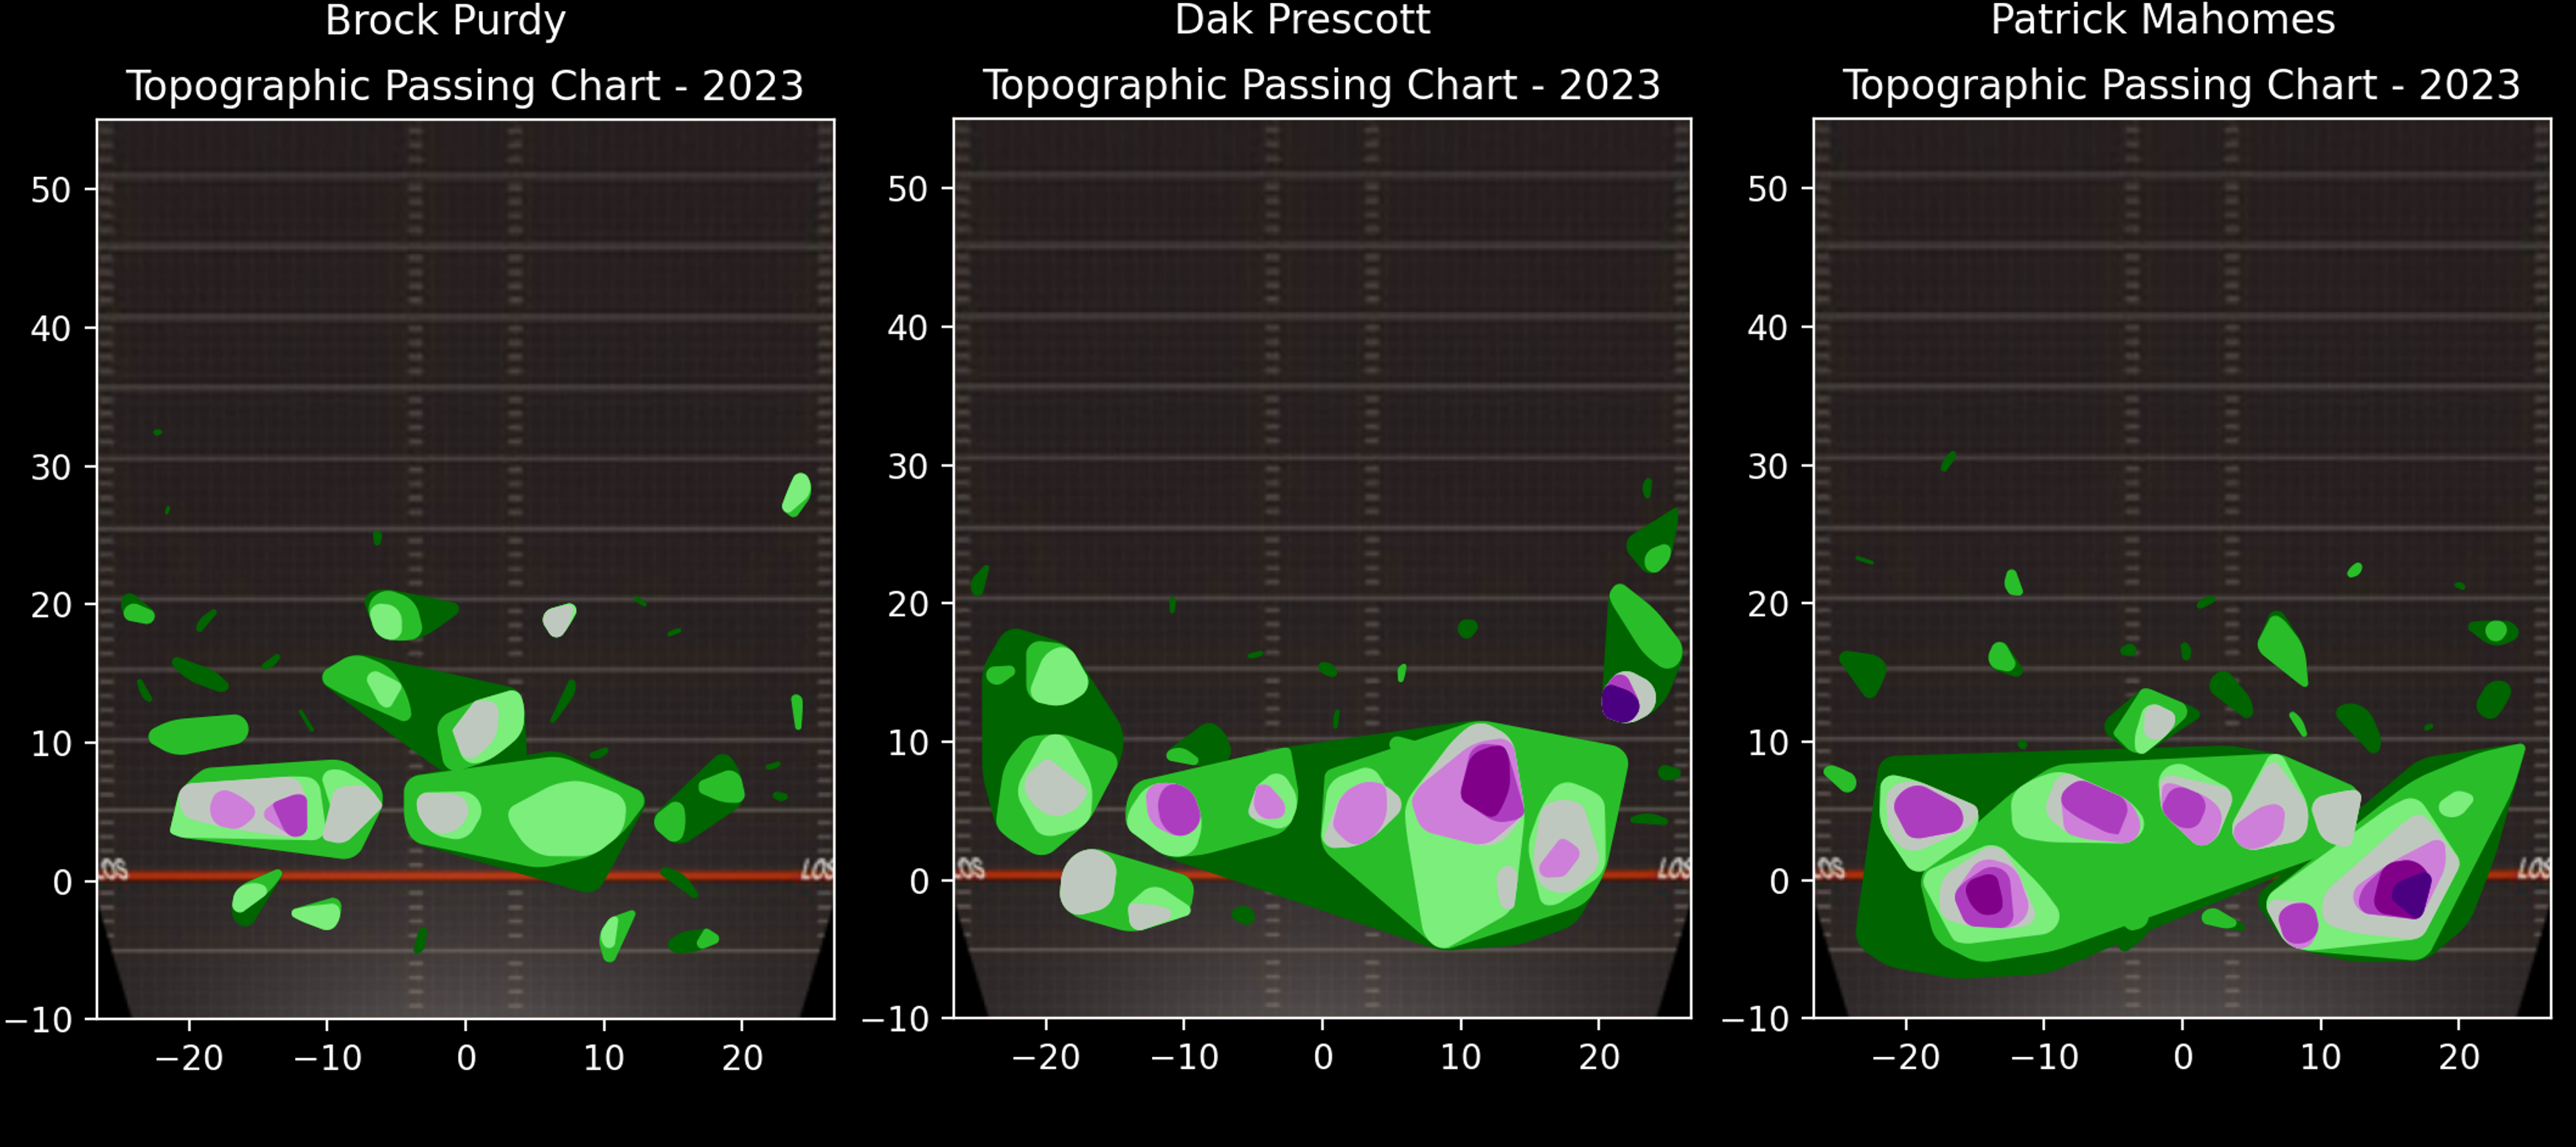
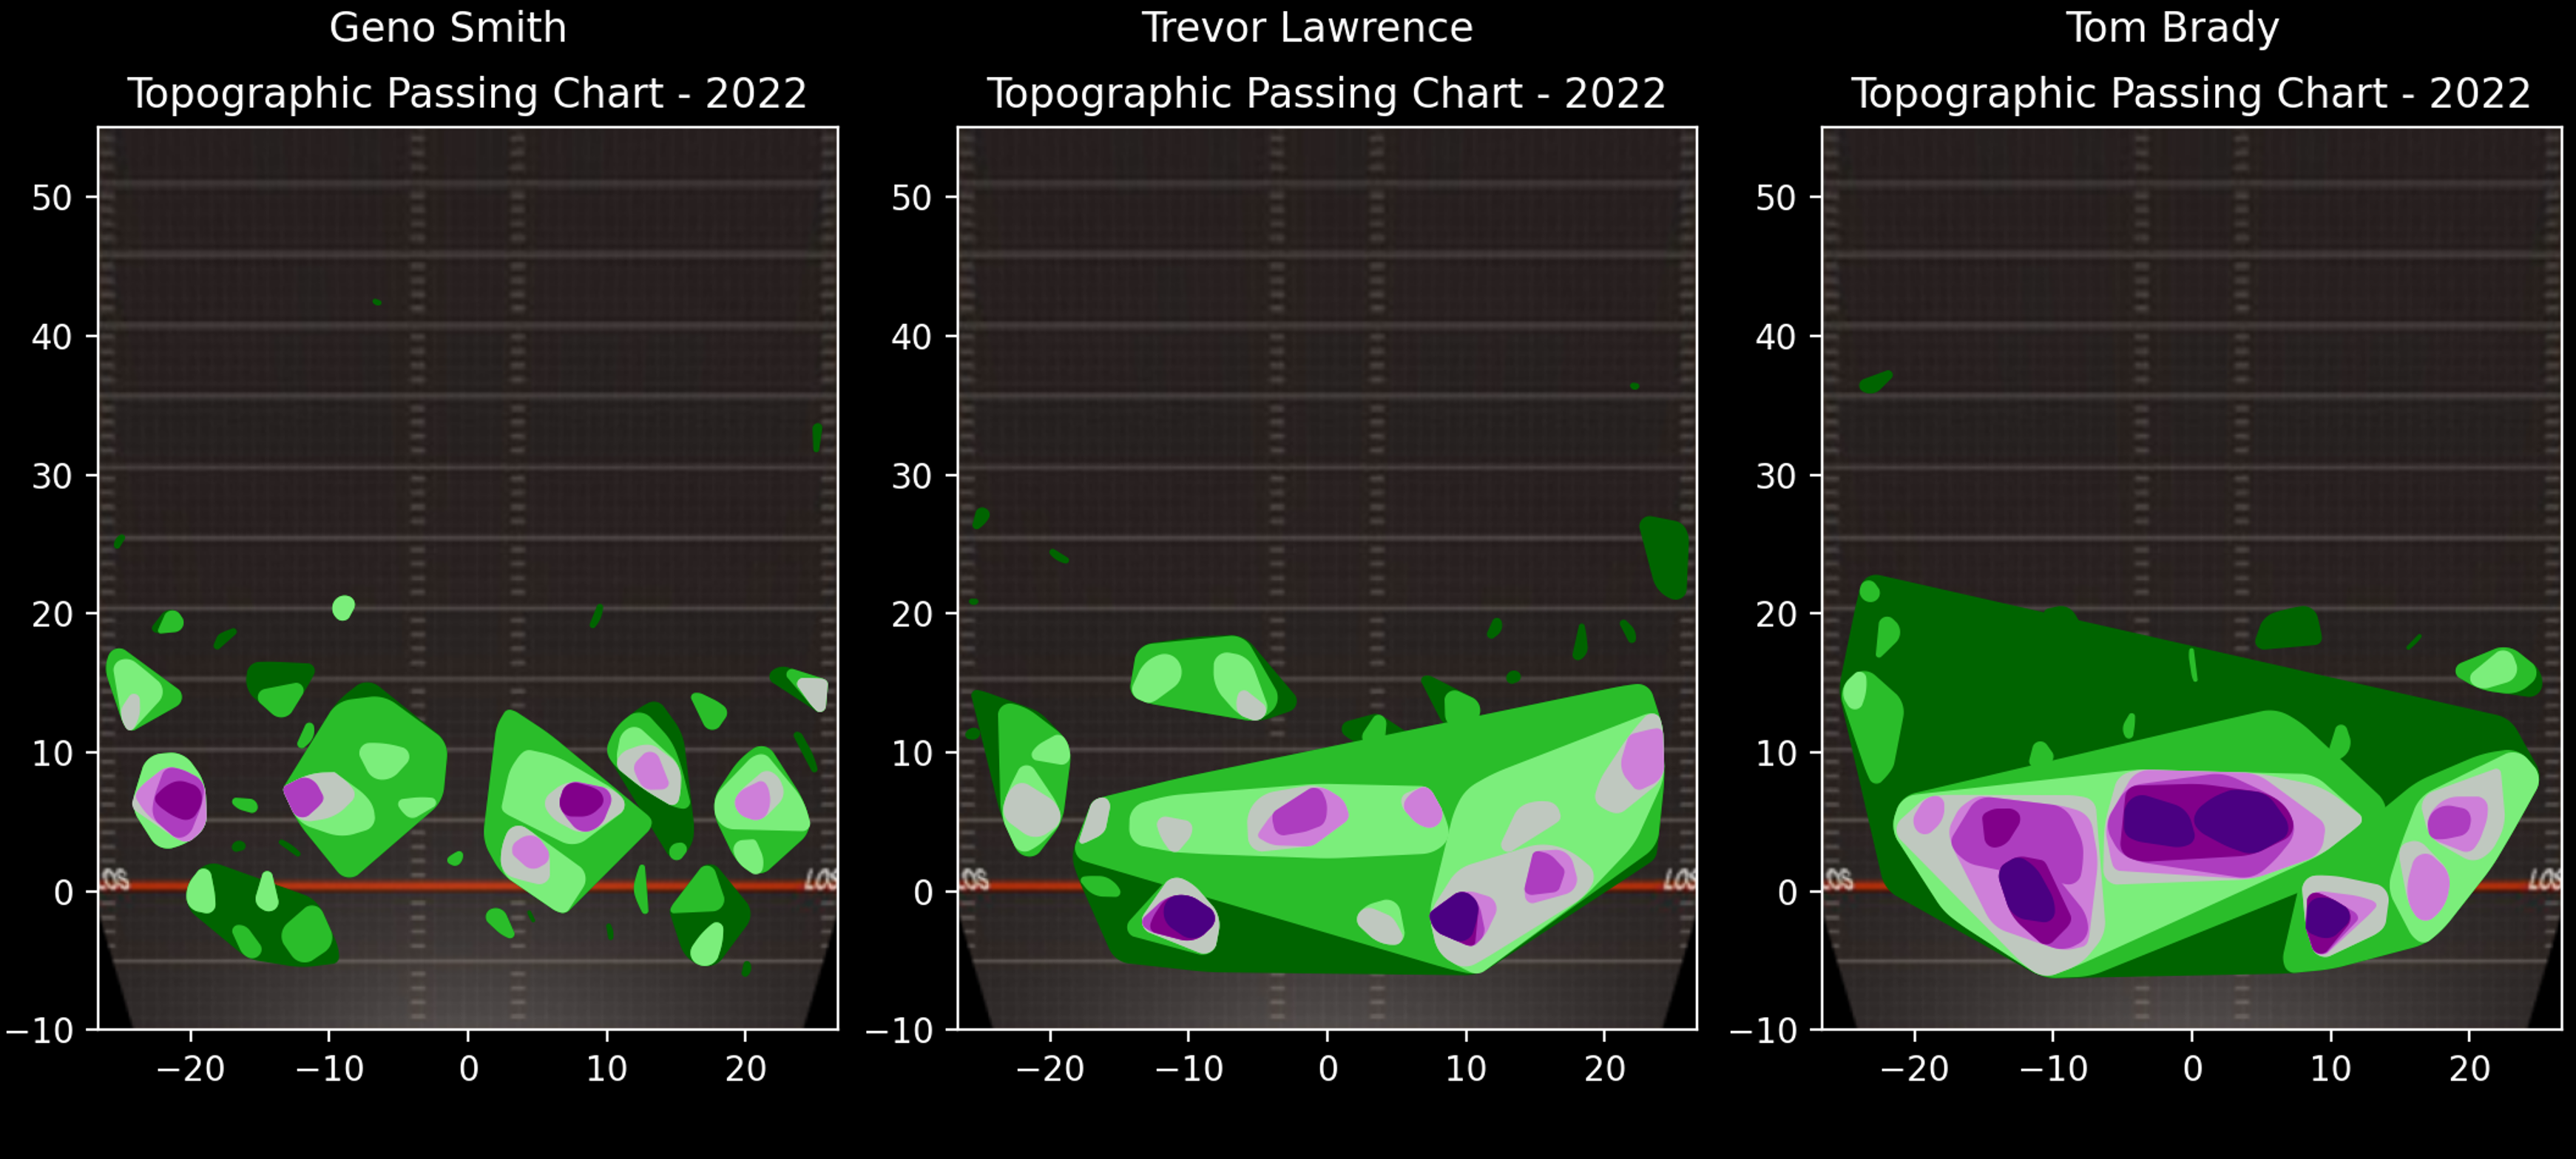
Utilizing Geographical Information Systems for the football's benefit, view statistics in a visually appealing manner. Topographic maps are typically used to showcase interval differences in elevation in a clean yet effective manner. Using the same logic, combined with classic K-Means clustering techniques, we can adapt topography to football. This project also explores the difficulties (and triumphs) behind scraping data directly from images.
About
Inspired by the works of Kirk Goldsberry, Sarah Mallepalle, Ron Yurko, Konstantinos Pelechrinis, and Samuel L. Ventura,
baseball has long used geographical data to track information like pitching zones. Recently,
the sport's use of geography has grown both in prevalence and scale with the growing popularity of spray charts to
plot against the fear-mongering defensive shift. Following baseball was basketball, which
now uses geographical data to track shooting zones. The NFL has recently hopped on the geography
train, however it gatekeeps its source data behind the veil of Next Gen Statistics. Fortunately,
this data can be gathered through the practice of image analysis, allowing it to be analyzed in
new ways by independent sources. Which teams use the same play calls on repeat? Whose patterns
are redundant and predictable? Did Matt Canada actually keep Kenny Pickett from throwing the ball
over the middle of the field? Geographical data will answer all of these questions and more.


